The Sticker Price is a Lie
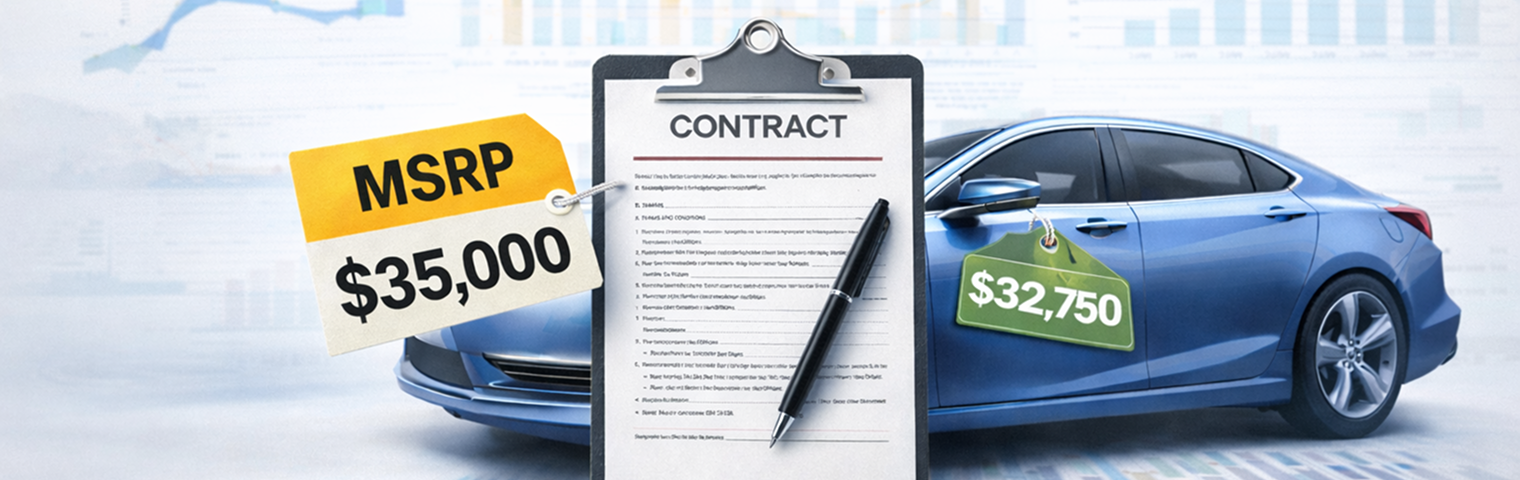
If you walk into a dealership believing the price on the window sticker (MSRP) is the price you will pay, you have already lost the negotiation.
For decades, the Manufacturer’s Suggested Retail Price has served as a psychological anchor—a number designed to make you feel good when you pay slightly less, or lucky when you "only" pay slightly more.
But at CarBuyInsight, we don't look at stickers. We look at signatures.
After analyzing over 10,000 verified purchase agreements uploaded by our community members, we found a startling truth: Less than 12% of buyers pay exactly MSRP.
The reality is a chaotic scatterplot of pricing where two neighbors buying the exact same car on the same day can pay a difference of $3,500 or more. Here is what our data revealed—and how you can ensure you are on the winning side of the math.
The "Iceberg" Effect: Hidden Markup Averages $2,100
The most consistent trend in our data analysis is what we call the "Iceberg Effect." The MSRP is just the tip visible above the water.
When we aggregated the "Total Cash Price" (the final number before taxes) across our database, we found that the average transaction price for popular mid-size SUVs was actually $2,100 higher than the MSRP listed on the manufacturer's website.
Where does this money go? It isn't in the base price. It hides in the "Addendum Sticker" next to the official Monroney label:
- Dealer Installed Accessories: Nitrogen tires, wheel locks, and mudguards ($800+ avg).
- Protection Packages: Paint sealant and fabric guard ($1,200+ avg).
- Market Adjustments: Pure profit markups on high-demand models.
The Insight: If you are negotiating based on MSRP, you are fighting the wrong battle. You need to negotiate the "Out-the-Door" (OTD) price, stripping away the Iceberg layers.
The "Hot vs. Cold" Model Variance
Our data proves that "Fairness" is not universal—it is specific to the car you are buying.
- The "Over" Group: For hybrids, minivans (like the Toyota Sienna), and high-performance sports cars, our data shows contracts consistently signed at 10-15% ABOVE MSRP. In these cases, paying "Sticker Price" is actually a massive victory.
- The "Under" Group: For full-size pickup trucks (Ram/Ford) and certain luxury sedans, the data flips. Contracts are routinely signed 8-12% BELOW MSRP due to hidden factory incentives and dealer holdbacks.
The Trap: Dealers love to use the "Over" mindset on "Under" cars. They will act like selling you a truck at MSRP is a favor, when community data shows everyone else is getting $4,000 off.
The "Zip Code" Tax
Perhaps the most frustrating finding in our 10,000-contract study is geographical variance.
We compared contracts for the exact same vehicle trim (e.g., a Honda CR-V EX-L) bought in different states.
- ● Buyer A (Florida): Paid $999 in "Dealer Doc Fees."
- ● Buyer B (California): Paid $85 in "Dealer Doc Fees."
- ● Buyer C (New York): Paid $175 in "Dealer Doc Fees."
That is a $900 difference for the exact same paperwork. While state laws cap some of these fees, many buyers assume these are "government taxes." They are not. They are dealer profits. Our data highlights exactly which states are "High Fee Danger Zones" so you can be extra vigilant.
The APR Disconnect
We also analyzed the Finance section of the contracts. The data revealed that buyers with the exact same credit score (720+) were receiving interest rates that varied by up to 2.5%.
On a $40,000 loan, that 2.5% difference costs you $2,800 in extra interest over 60 months.
Why? Because dealers are allowed to mark up the "Buy Rate" (the rate the bank gives them) and keep the difference. If you don't know the base rate, you fund their profit.
Conclusion: Don't Guess. Benchmark.
The days of wondering "Did I get a good deal?" are over.
When you rely on a single dealership's word, you are guessing. When you tap into the Fairness Intelligence Network, you are benchmarking.
How to leverage this data today:
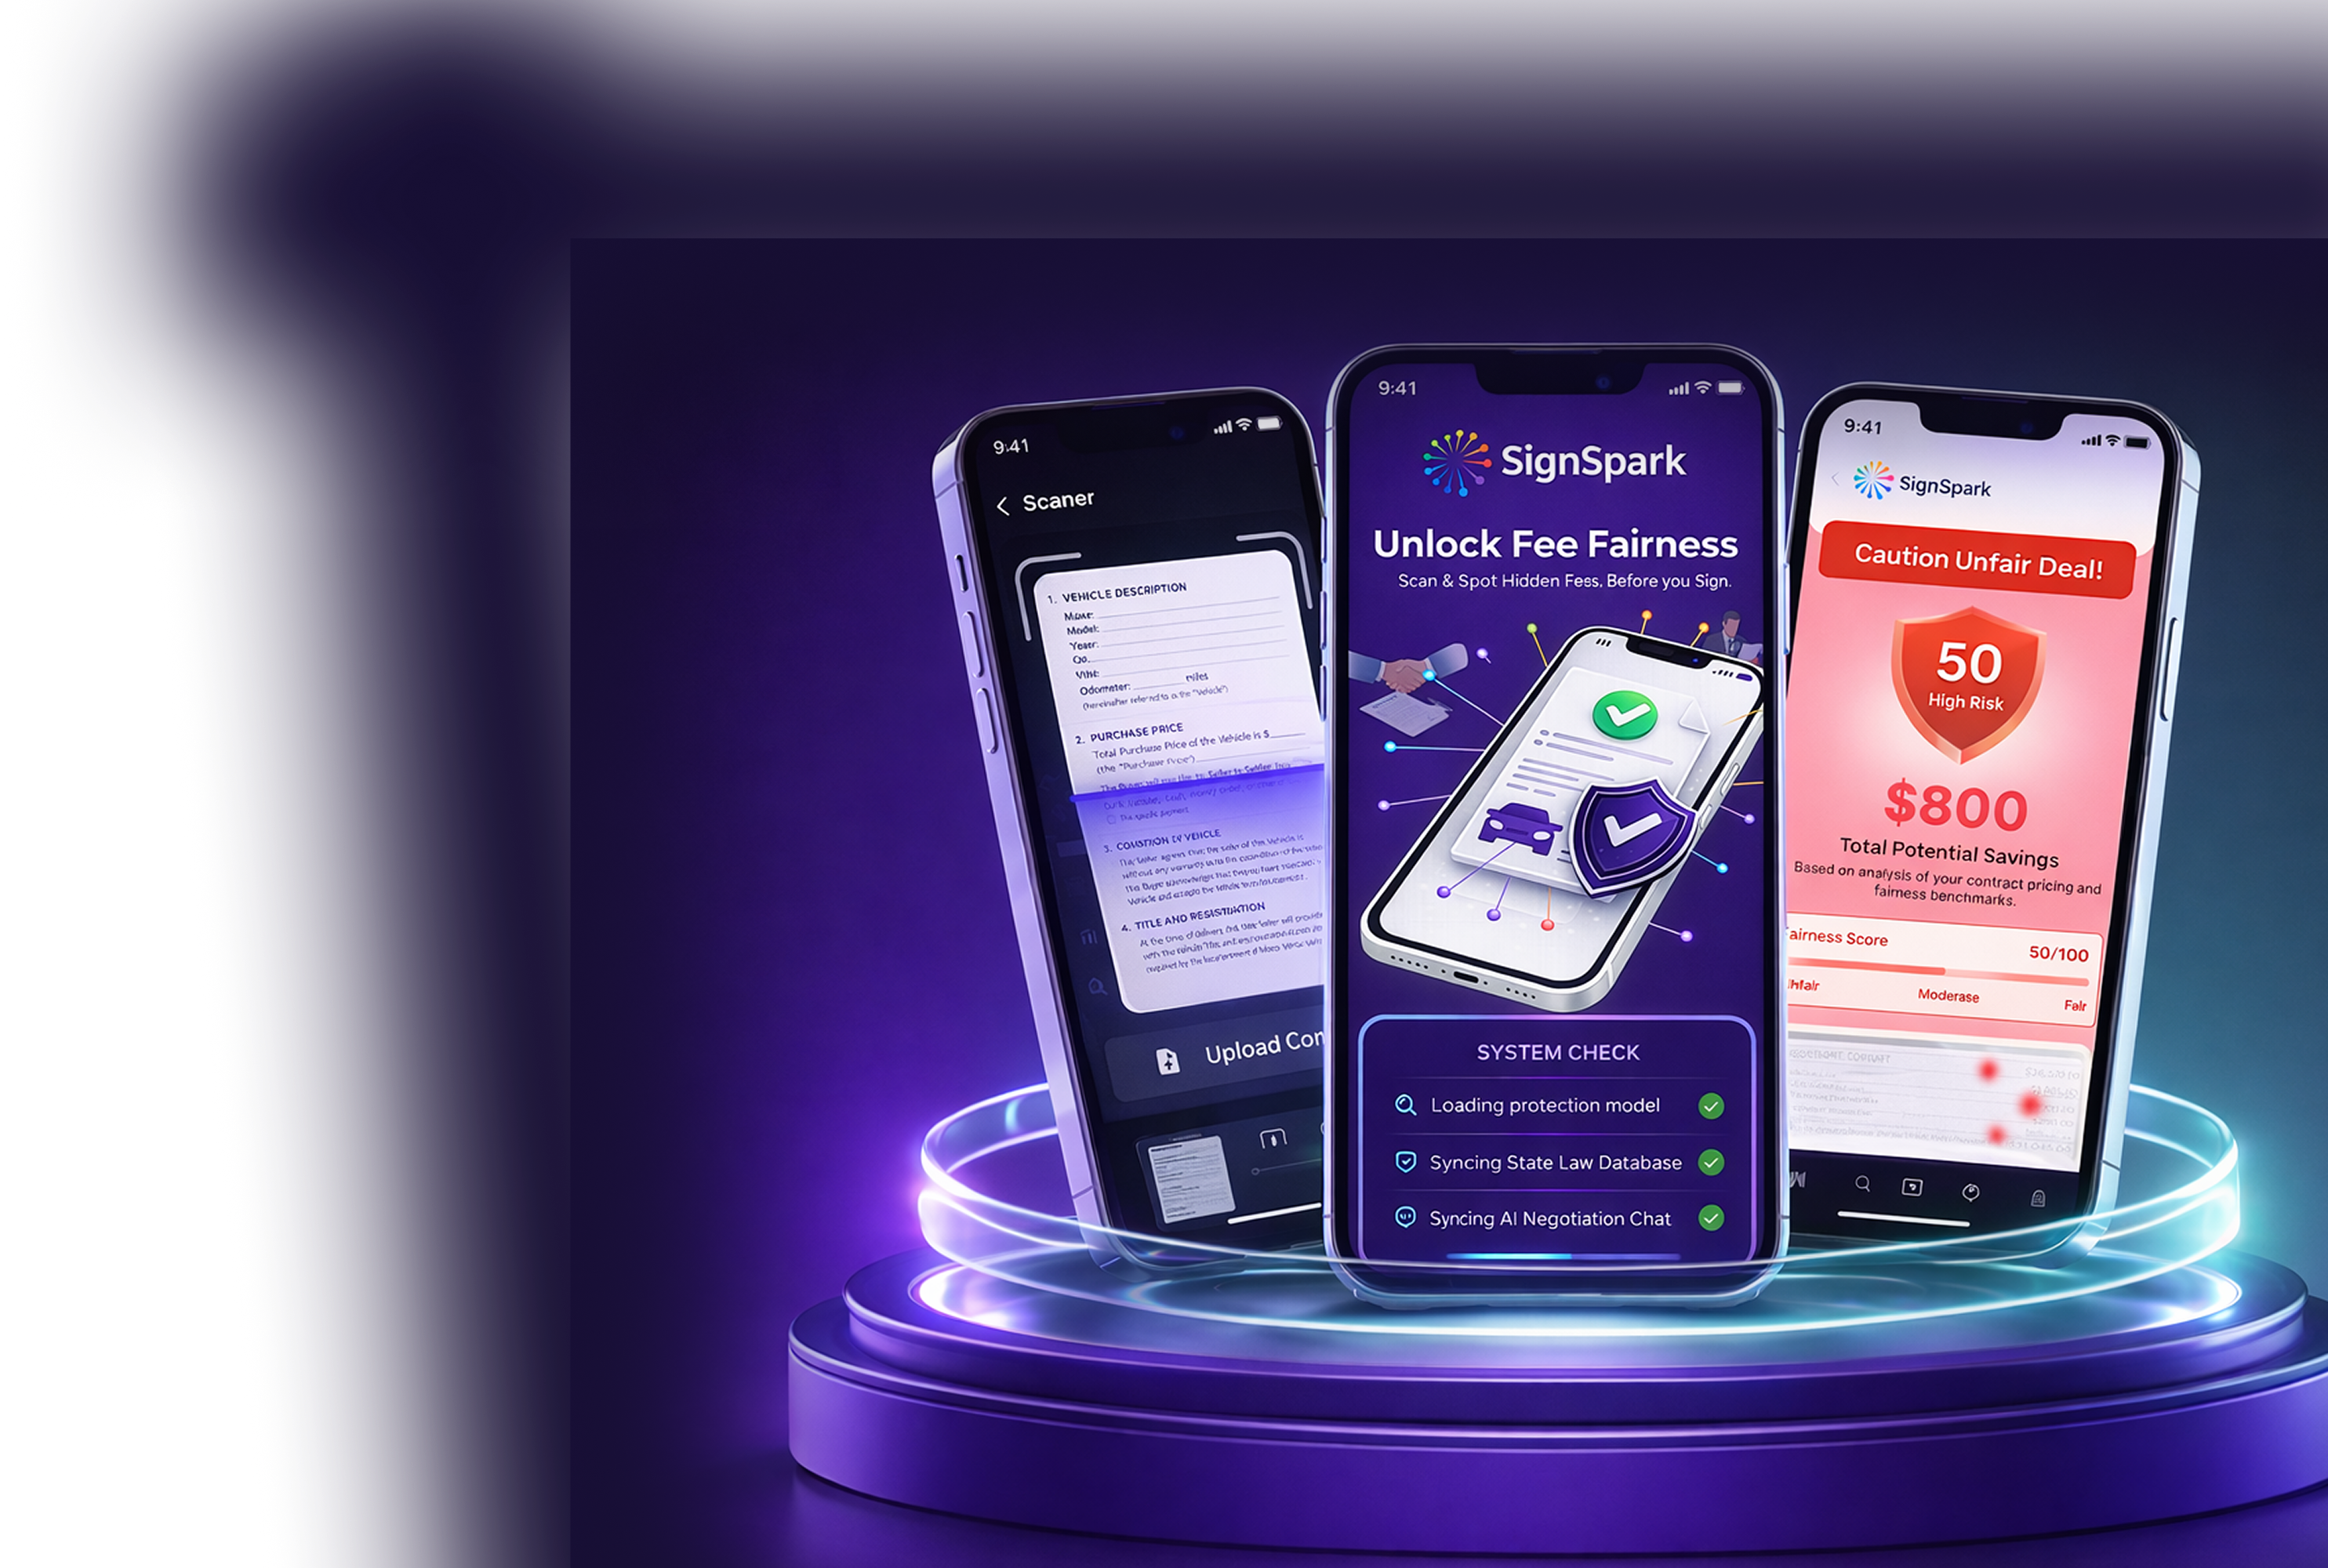
- Download SignSpark AI.
- Upload your quote or contract.
- Get your Fairness Score. Our AI compares your specific deal against the aggregated data of thousands of similar purchases to tell you instantly: Are you paying too much?
[View the Live Data] [Get My Fairness Report]
Stop guessing. Start saving.
Upload your contract now for an instant fairness check.